
Module 6 · Know what's working: tracking and the 15-minute read
The five numbers that matter
Open Google Ads and it will show you roughly two hundred numbers, most of them designed to make you feel like you should be doing something. You don’t need them. Five numbers run a local firm’s account, and once you can read them as health signals — with plain thresholds, not anxiety — you can glance at your dashboard and know in ninety seconds whether things are fine, wobbling, or leaking. This lesson sets up those five columns once, teaches you to read them as a trend rather than a snapshot, and gives you a small diagnosis map so that when a number goes wrong you know exactly where to look.
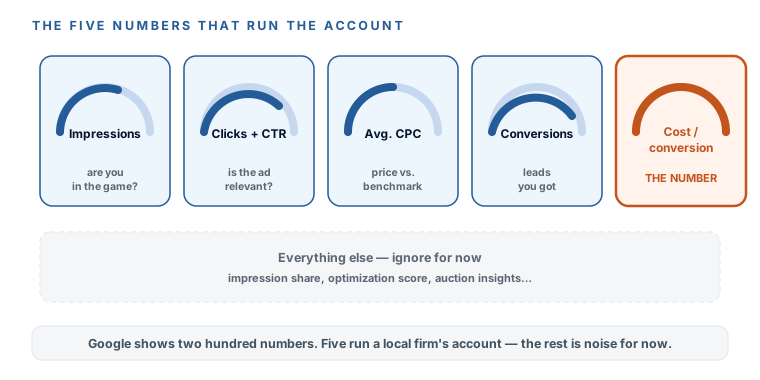
The five numbers — and what each one is telling you
Set these five columns up once (the walkthrough video shows the column editor), save the set, and your dashboard opens ready every week. Here’s what each one is actually asking.
- Impressions — are you even in the game? How often your ad showed at all. Near zero means something upstream is broken: budget too low, the campaign paused, an eligibility issue, or geography set so tight nobody qualifies. You can’t win an auction you’re not in.
- Clicks and CTR — is the ad relevant? Click-through rate is clicks divided by impressions. For a tight local search campaign, a CTR under roughly 2–3% suggests the ad or the keywords are missing the searcher. For bearing, not grading: the 2026 legal median CTR is about 5.9% (a large-sample vendor study, dated). Use it as a compass reading, not a report card.
- Average CPC — your reality versus the benchmark. What you’re actually paying per click. Compare it to the m0 benchmark — legal runs about $9.87 at the median. Wildly higher usually means fierce competition or a low Quality Score dragging your price up.
- Conversions and cost per conversion — THE number. Conversions are your counted leads (calls and forms, from the last two lessons). Cost per conversion is what a lead costs you — the number the whole account lives or dies on. Judge it against your m0 worksheet, and keep the benchmarks in view: legal cost-per-lead runs about $132, dental about $73 (2026 medians, dated, sourced — and yours will differ).
| Number | The question it asks | Bearing (2026, dated) |
|---|---|---|
| Impressions | Are you even in the game? | Near-zero = something upstream broke |
| Clicks & CTR | Is the ad relevant? | Legal median ~5.9%; worry under ~2–3% |
| Avg CPC | Your price vs the benchmark | Legal ~$9.87 |
| Conversions | Leads you actually counted | — |
| Cost per conversion | THE number | Legal ~$132, dental ~$73 |
Read the trend, not the snapshot
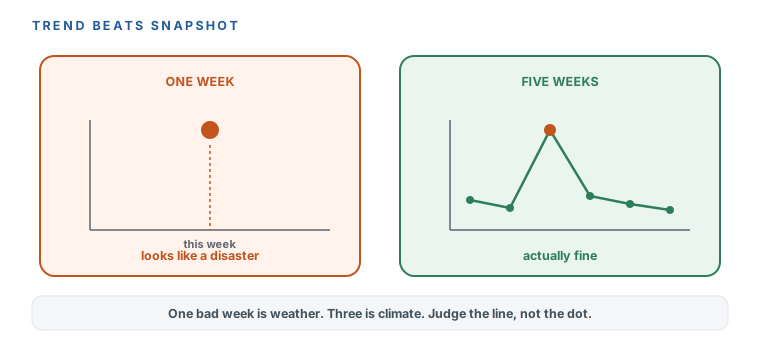
This is the habit that separates calm operators from panicked ones. Any single week is weather — a slow Tuesday, a competitor’s sale, a fluke of the auction. Compare this week to the last four, not to a feeling. One bad week is noise; three bad weeks in a row is a signal. When you save your column set, look at it over a rolling window rather than a single day, and you’ll stop making the classic beginner mistake of tearing the account apart over a number that would have corrected itself by Friday.
What to ignore — on purpose
Just as important as the five is the list of things you will deliberately not worry about at this stage. Impression share, auction insights, and optimization score are distractions for a firm your size — optimization score especially, which is a sales tool dressed as a report card (m7 has words about it). Quality Score is worth understanding but not worth checking daily; it shows up in your CPC anyway. Ignoring these isn’t laziness, it’s focus: five numbers you act on beat two hundred you stare at.
When a number goes wrong, look here
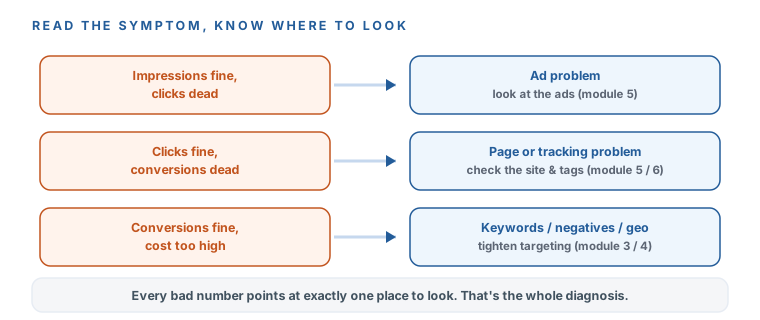
The five numbers don’t just report — read as pairs, they diagnose. Three combinations cover almost everything that goes wrong, and each points at a specific place you already know how to fix.
- Impressions fine, clicks dead → an ad problem. People are seeing you and not clicking — the copy or the offer is missing. Back to the ads (m5).
- Clicks fine, conversions dead → a page or tracking problem. They’re clicking and not converting — either the landing page is leaking (m5) or your tracking isn’t firing (m6). Check tracking first; a “zero conversions” that’s really a broken tag has fooled a lot of people.
- Conversions fine, cost too high → a keyword, negative, or geo problem. You’re getting leads but paying too much for them — you’re buying some junk clicks along the way. Back to keywords and negatives (m3, m4) and the location fix (m4).
| The symptom | The diagnosis | Where to look |
|---|---|---|
| Impressions fine, clicks dead | An ad problem | The ads (m5) |
| Clicks fine, conversions dead | A page or tracking problem | Landing page (m5) or tracking (m6) — check tracking first |
| Conversions fine, cost too high | A keyword, negative, or geo problem | Keywords & negatives (m3, m4), location (m4) |
You can open your account and read it in ninety seconds. Your five columns are set and saved — impressions, clicks and CTR, average CPC, conversions, and cost per conversion — and you know what each one is asking and roughly where the benchmark sits (legal CTR ~5.9%, CPC ~$9.87, cost-per-lead ~$132; yours will differ, and the numbers are dated). You read them as a trend against the last four weeks, not a panic over one day, and you know which two hundred metrics to ignore for now. Best of all, you’ve got the three diagnosis pairs, so a bad number tells you exactly where to look instead of leaving you guessing. Next: we compress the whole operating job into one repeatable fifteen-minute block on your calendar.
Watch this step
A real local lead-gen account read the way this lesson teaches — conversions defined as calls and forms, five numbers that matter, and an explicit warning against drowning in the two hundred sub-reports Google shows you. It’s from an independent creator — credited below, so go give them a follow.
You NEED TO KNOW These Google Ads Metrics...
More learning resources
Still want another angle? These are hand-picked and vetted to line up with this lesson — from creators and sites worth your time.